Business intelligence, market intelligence and predictive analytics.
We connect your ERP, stock and production data with open market data – financial statements, the Business Register and contracts from the Central Register of Contracts – and turn them into predictions you can explain: who is growing, who is buying, whom to approach, and where stock, purchasing, quality or cash flow are at risk.
Explainable models with predictions and probabilities. Every finding linked to its source. We say openly where your data carry no reliable signal.
Real interface · real aggregated data
Real interface with aggregated results from a study of 117,636 Slovak companies, using data as of 1 September 2026. The interface is in English.
Three ways to read your market and your business
Market Intelligence (IntStat)
Pilot
Open data – financial statements, the Business Register and contracts from the Central Register of Contracts – show who is growing, who is buying and whom to approach. Every finding links to its source.
Business Prediction
Study on 117,636 companies
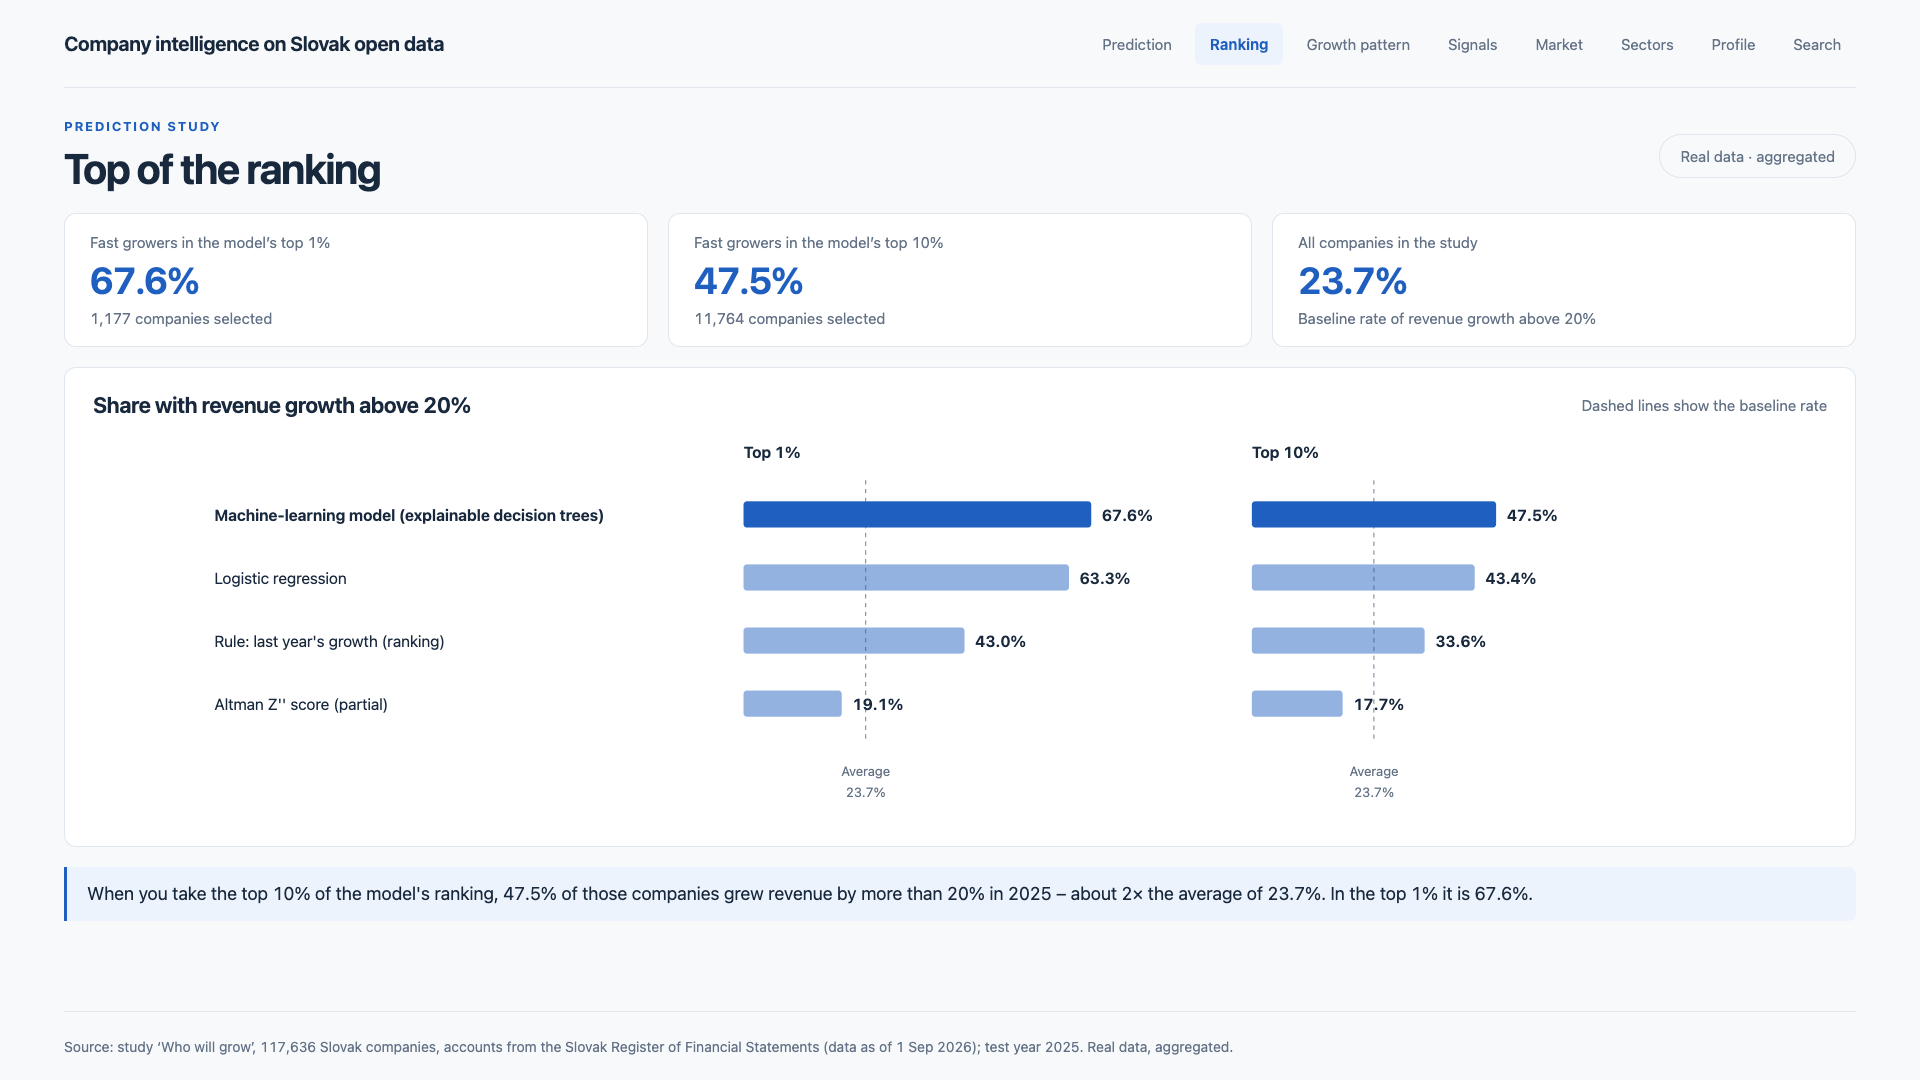
Combined with Predictive Analytics, we can connect market signals with your own history to prioritise customers, suppliers and tenders. In the study, when taking the top 10% of the ranking, 47.5% of companies increased revenue by more than 20% in 2025, approximately twice the average of 23.7%; this is a ranking aid, not a certainty.
Predictive Analytics
Starts with a data audit
A layer we build over your ERP, stock and production data – stockouts, purchasing, supplier risk, quality and cash flow – using machine learning on tabular data: explainable decision-tree models that give both predictions (how much, when) and probabilities (how likely), each with the factors that drive it.
How we work
Every finding is linked to its source.
Every prediction comes with the factors that drive it.
We say openly where your data carry no reliable signal.
It starts with a predictive data audit on your own data.
The interface on real data
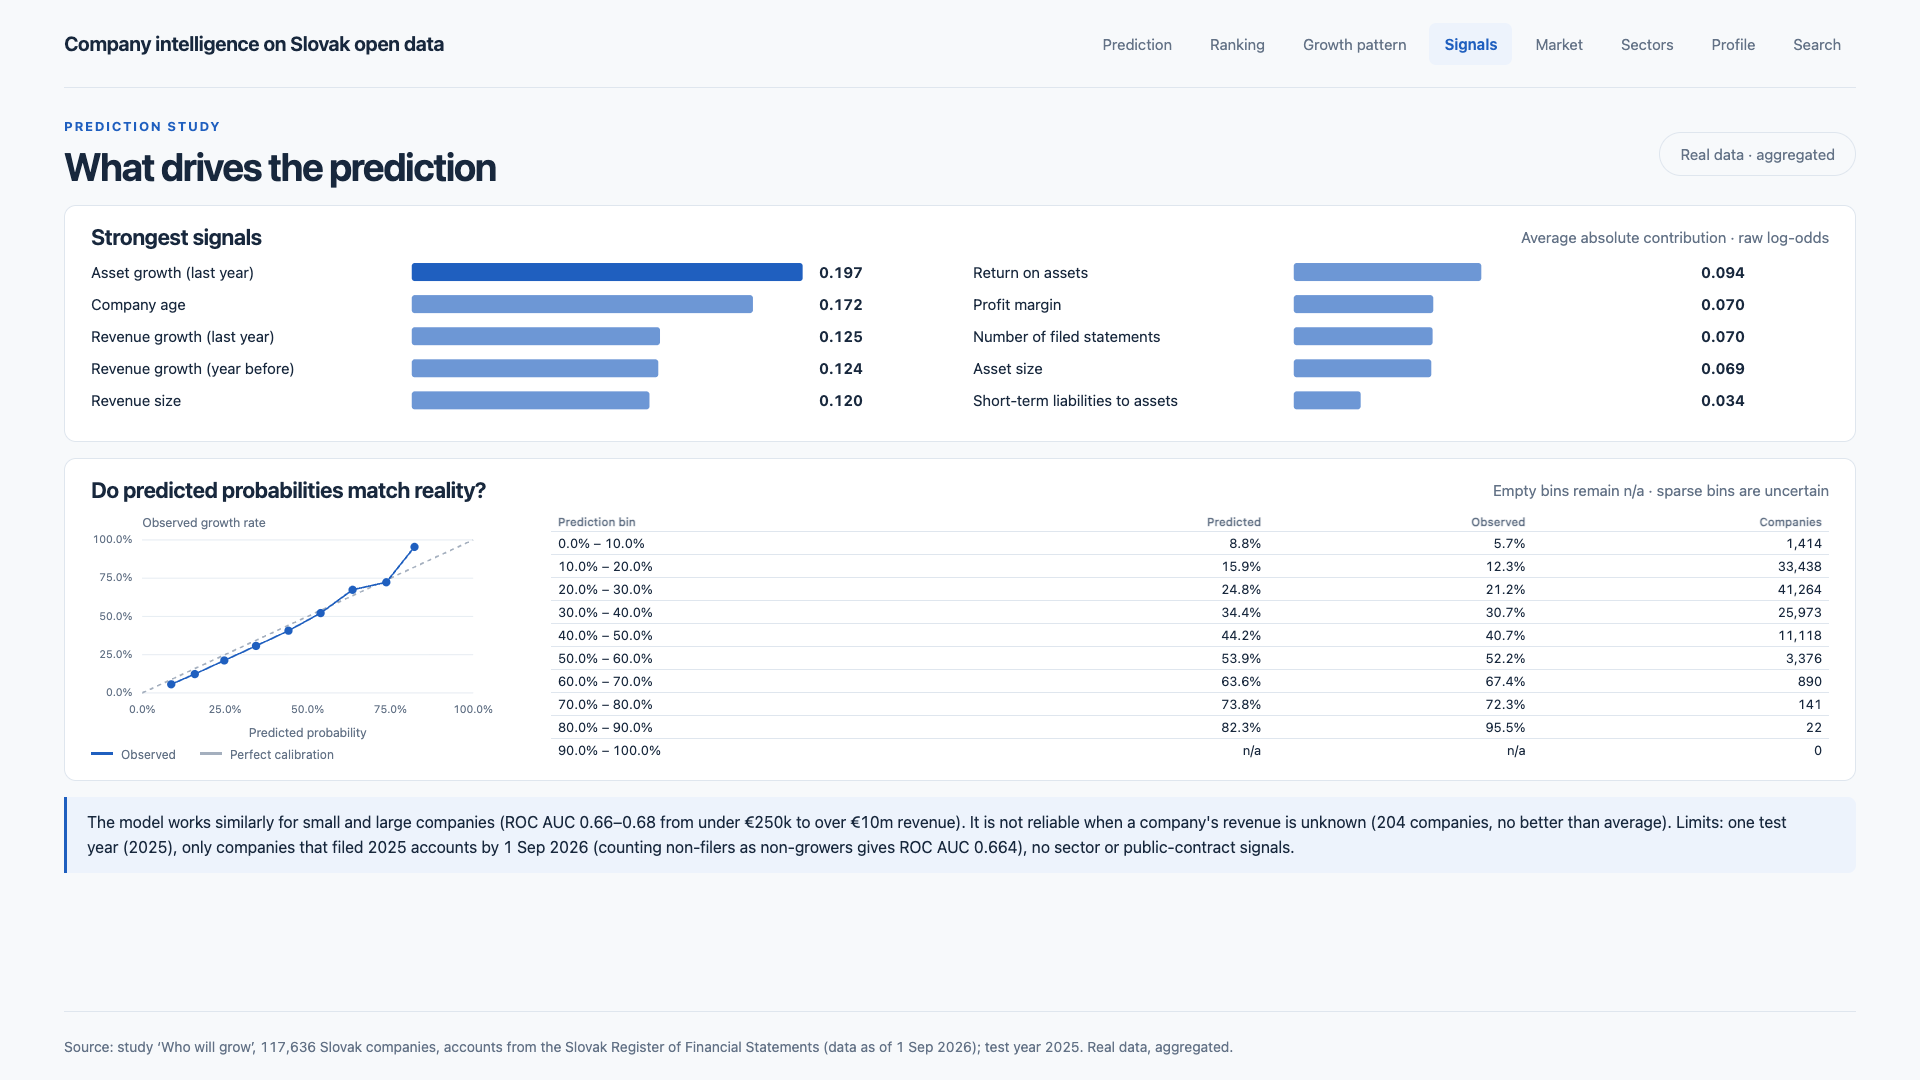
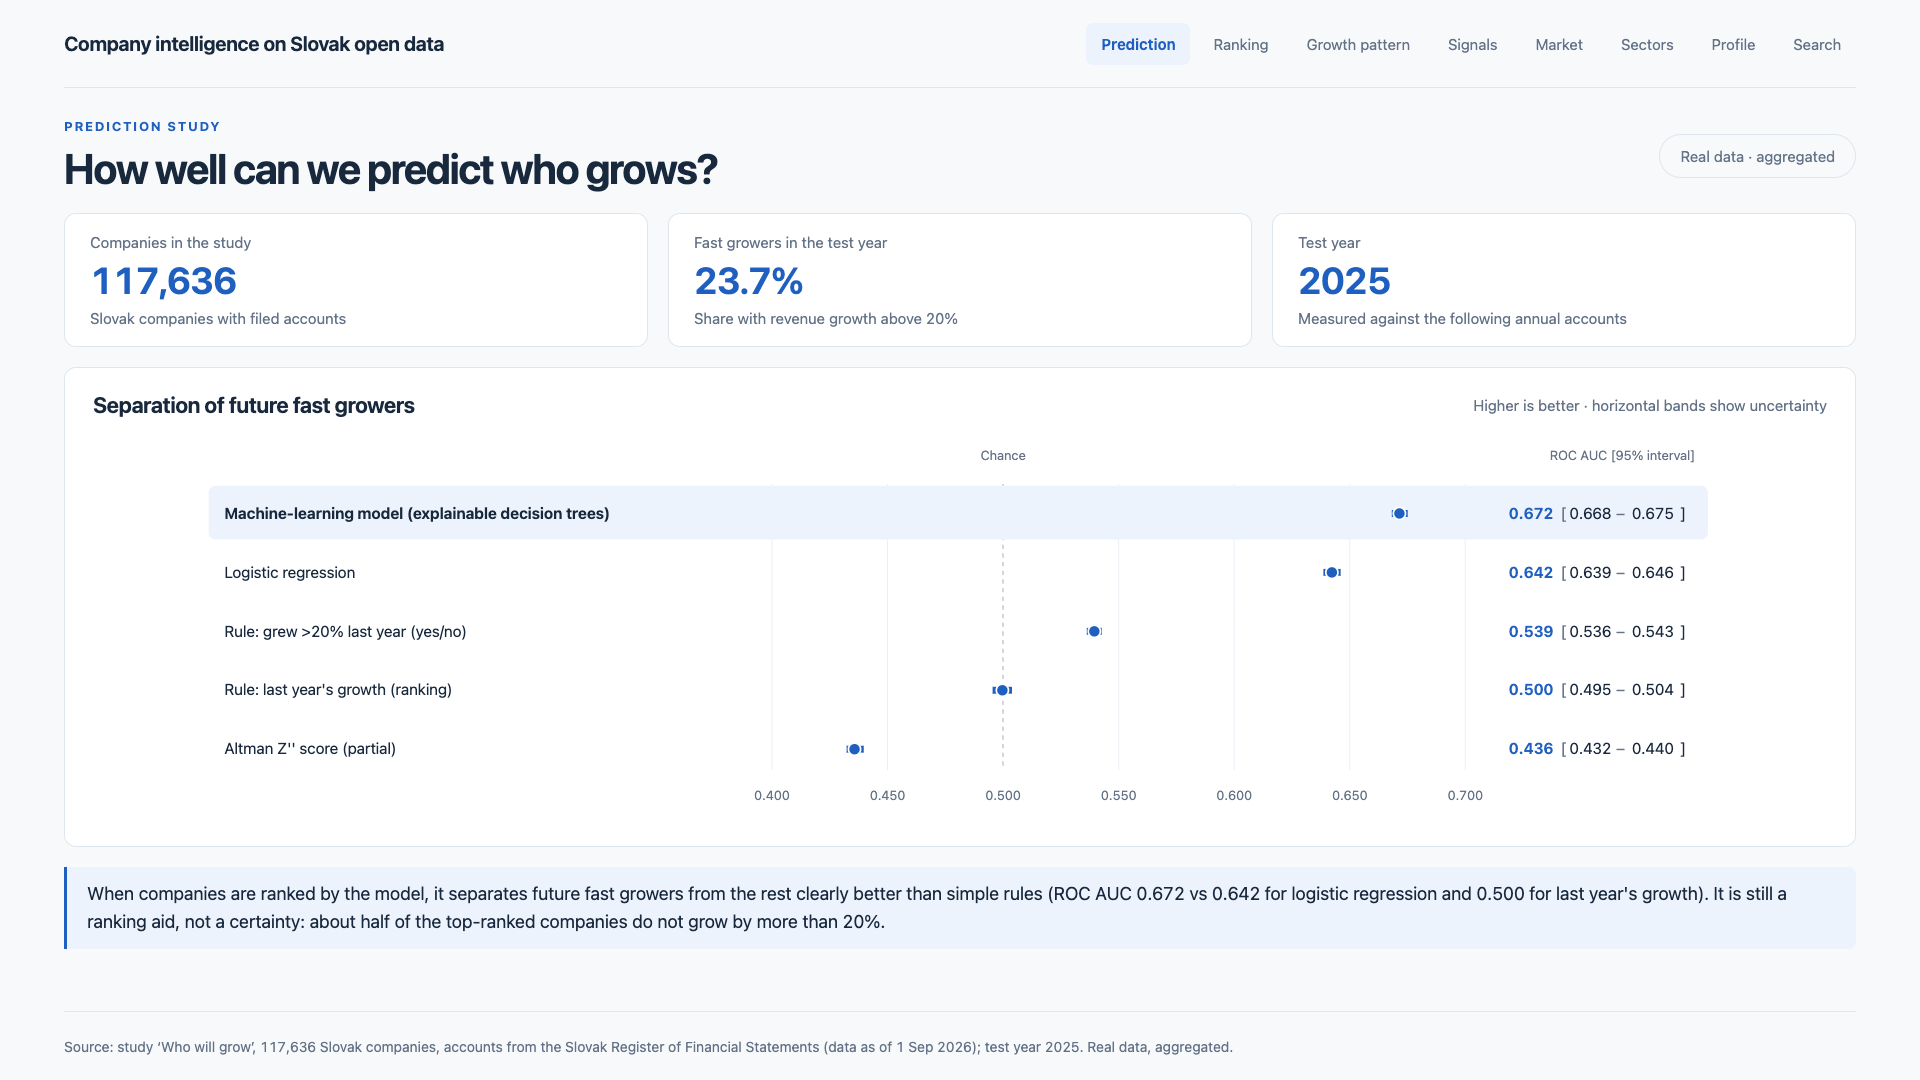
Study limits: one test year (2025), only companies that filed 2025 accounts by 1 September 2026, and no sector or public-contract signals. If companies without filed accounts are counted as non-growers, ROC AUC is 0.664. The screenshots show the English interface.
Prediction
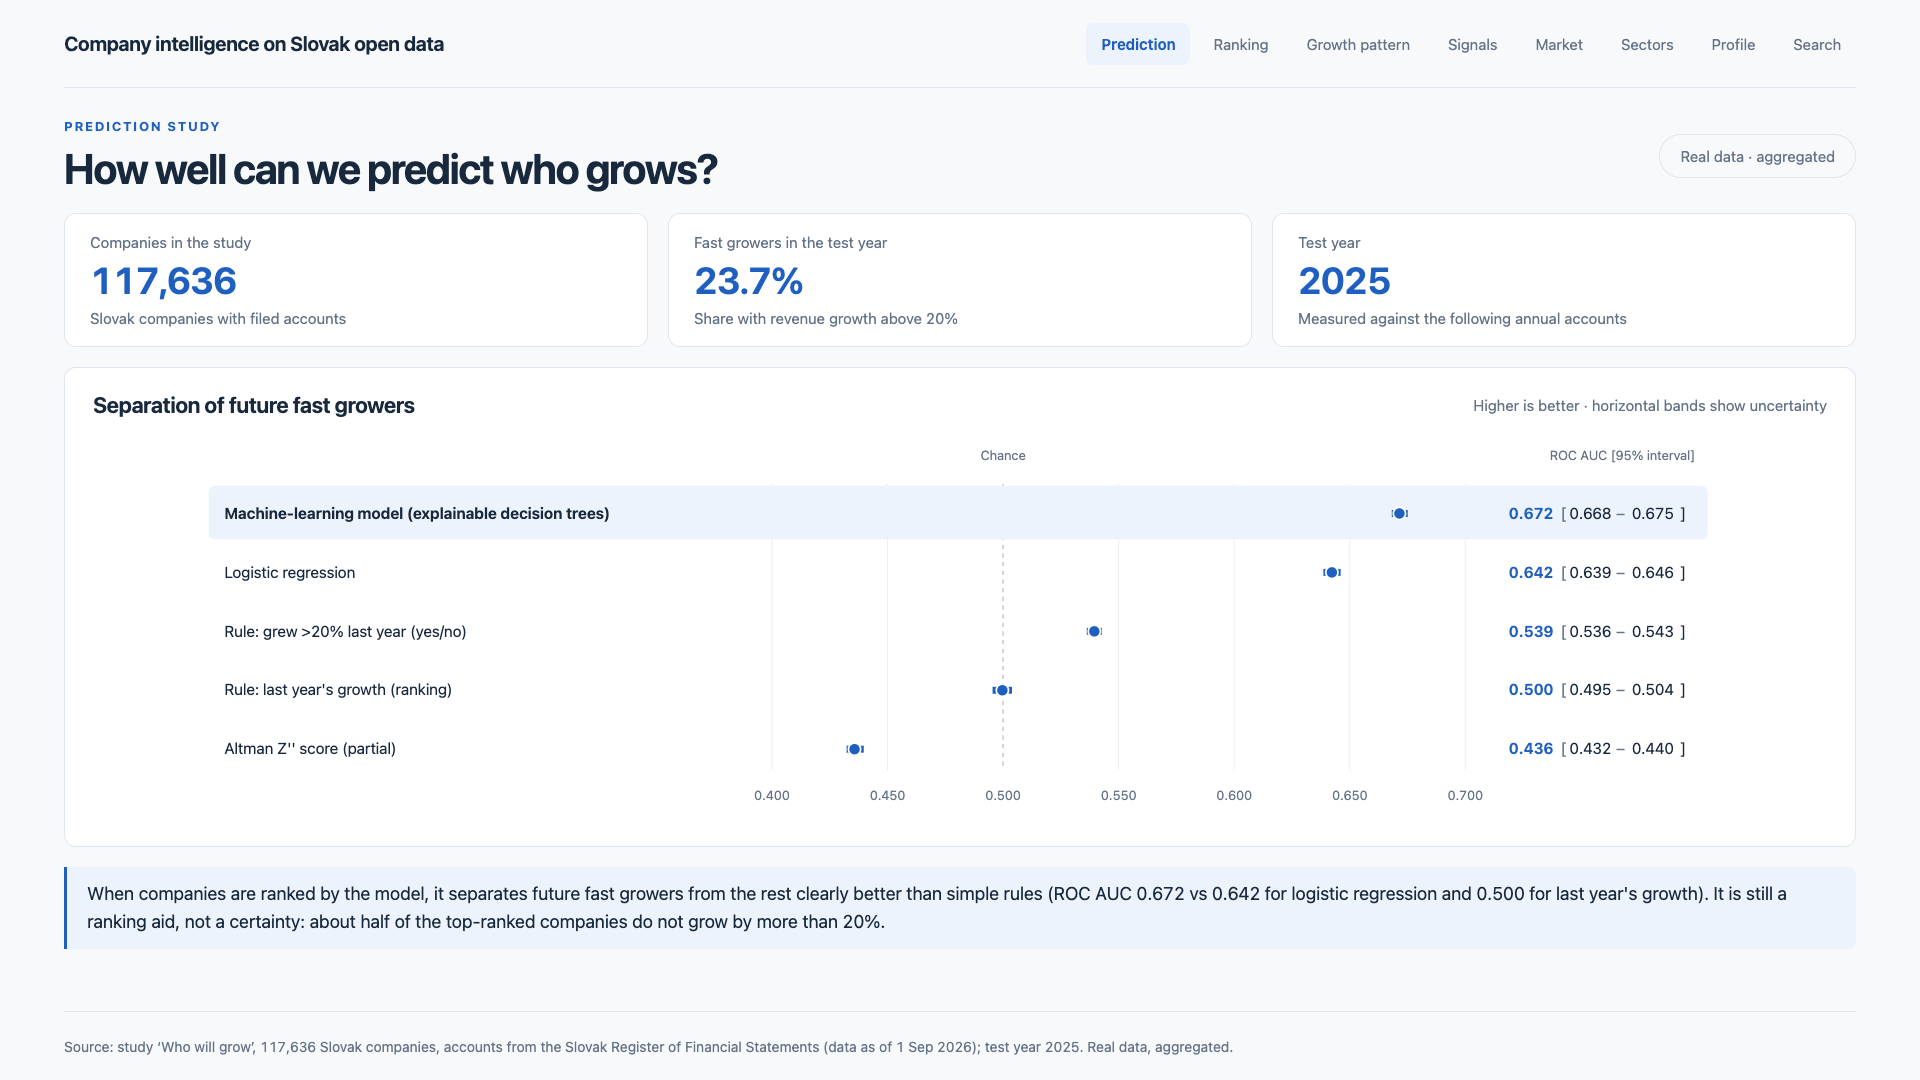
When the model ranks companies, it separates future fast growers better than simple rules: ROC AUC is 0.672, compared with 0.642 for logistic regression and 0.500 for last year’s growth. It remains a ranking aid, not a certainty: about half of the companies at the top do not grow by more than 20%.
When taking the top 10% of the model’s ranking, 47.5% of these companies increased revenue by more than 20% in 2025, about twice the average of 23.7%. In the top 1%, the share is 67.6%.
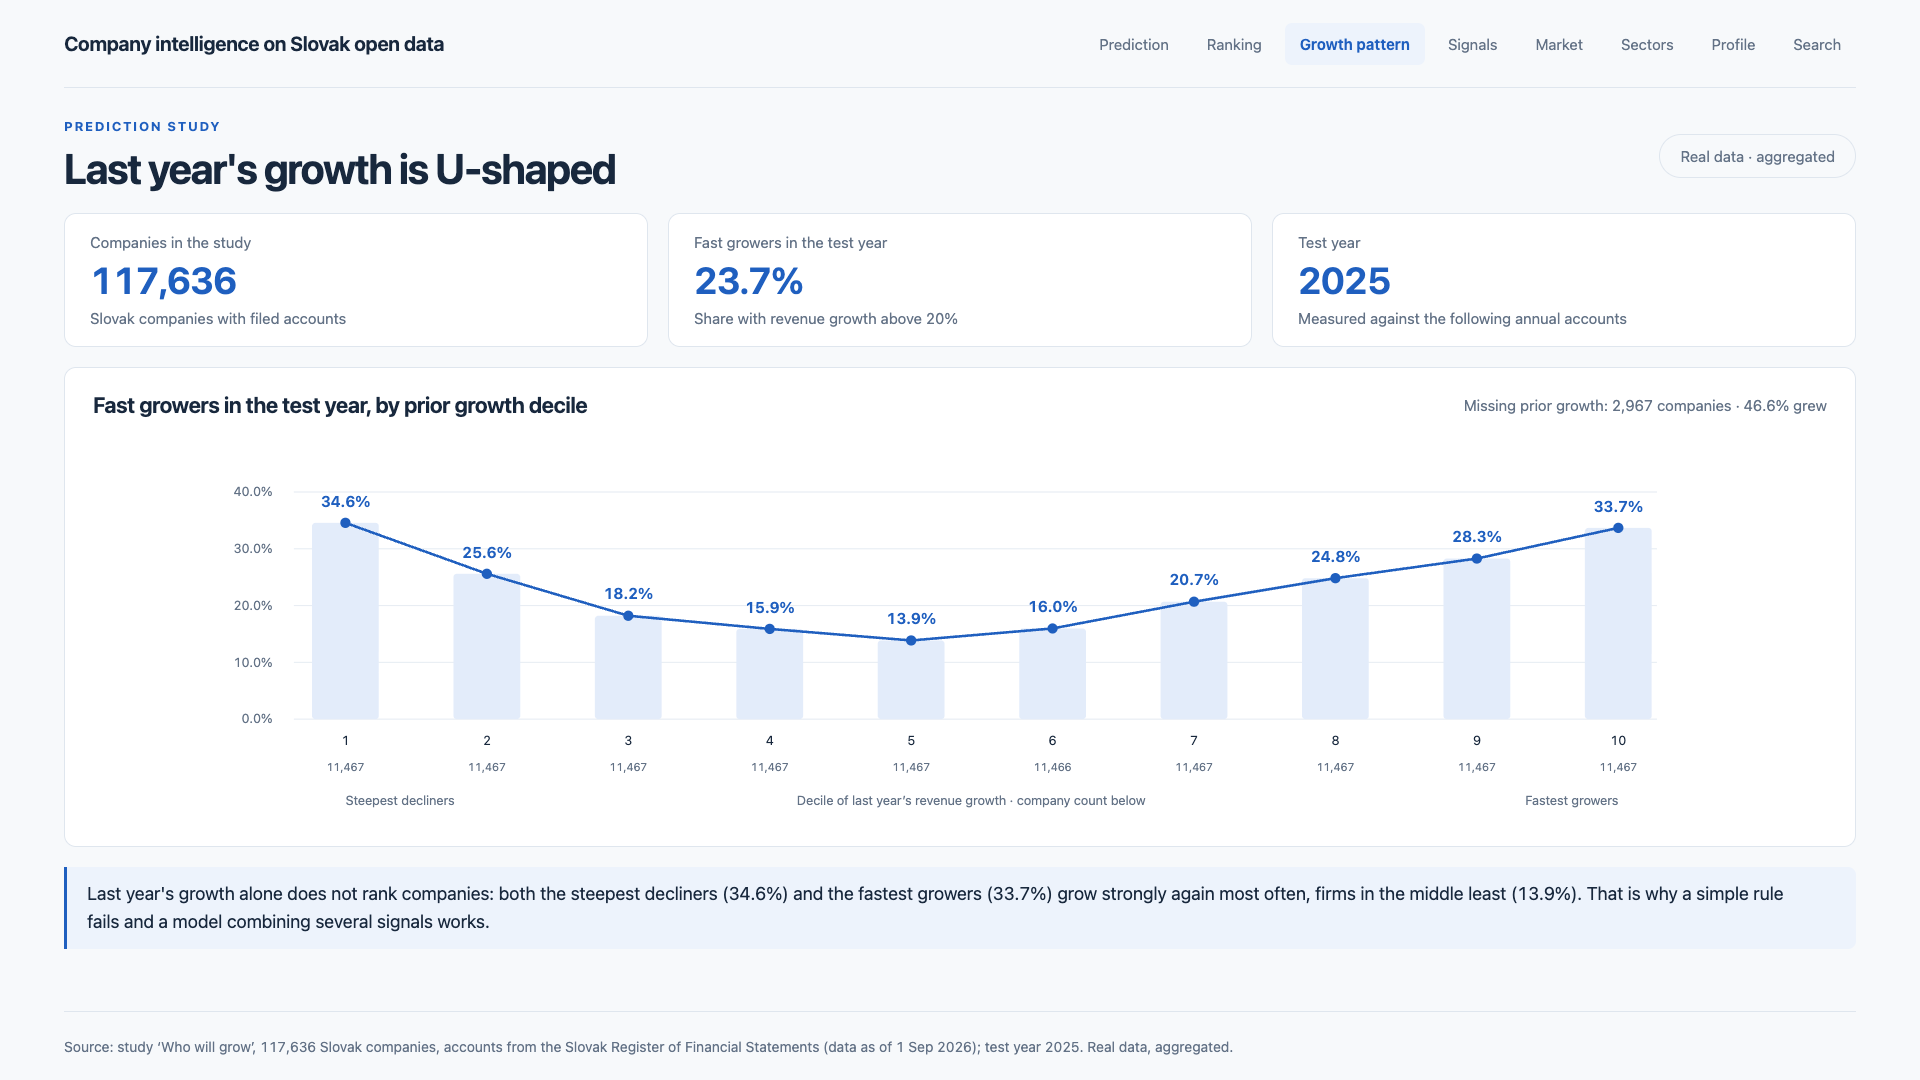
When companies are grouped by last year’s growth, strong growth recurs most often among the steepest decliners (34.6%) and the fastest growers (33.7%), and least often in the middle (13.9%). Last year’s growth alone therefore fails as a ranking rule; the model combines several signals.
When revenue is known, the model performs similarly for small and large companies: ROC AUC is 0.66–0.68 across revenue bands from under €250,000 to over €10 million. When revenue is unknown (204 companies), the result is no better than average and is unreliable.
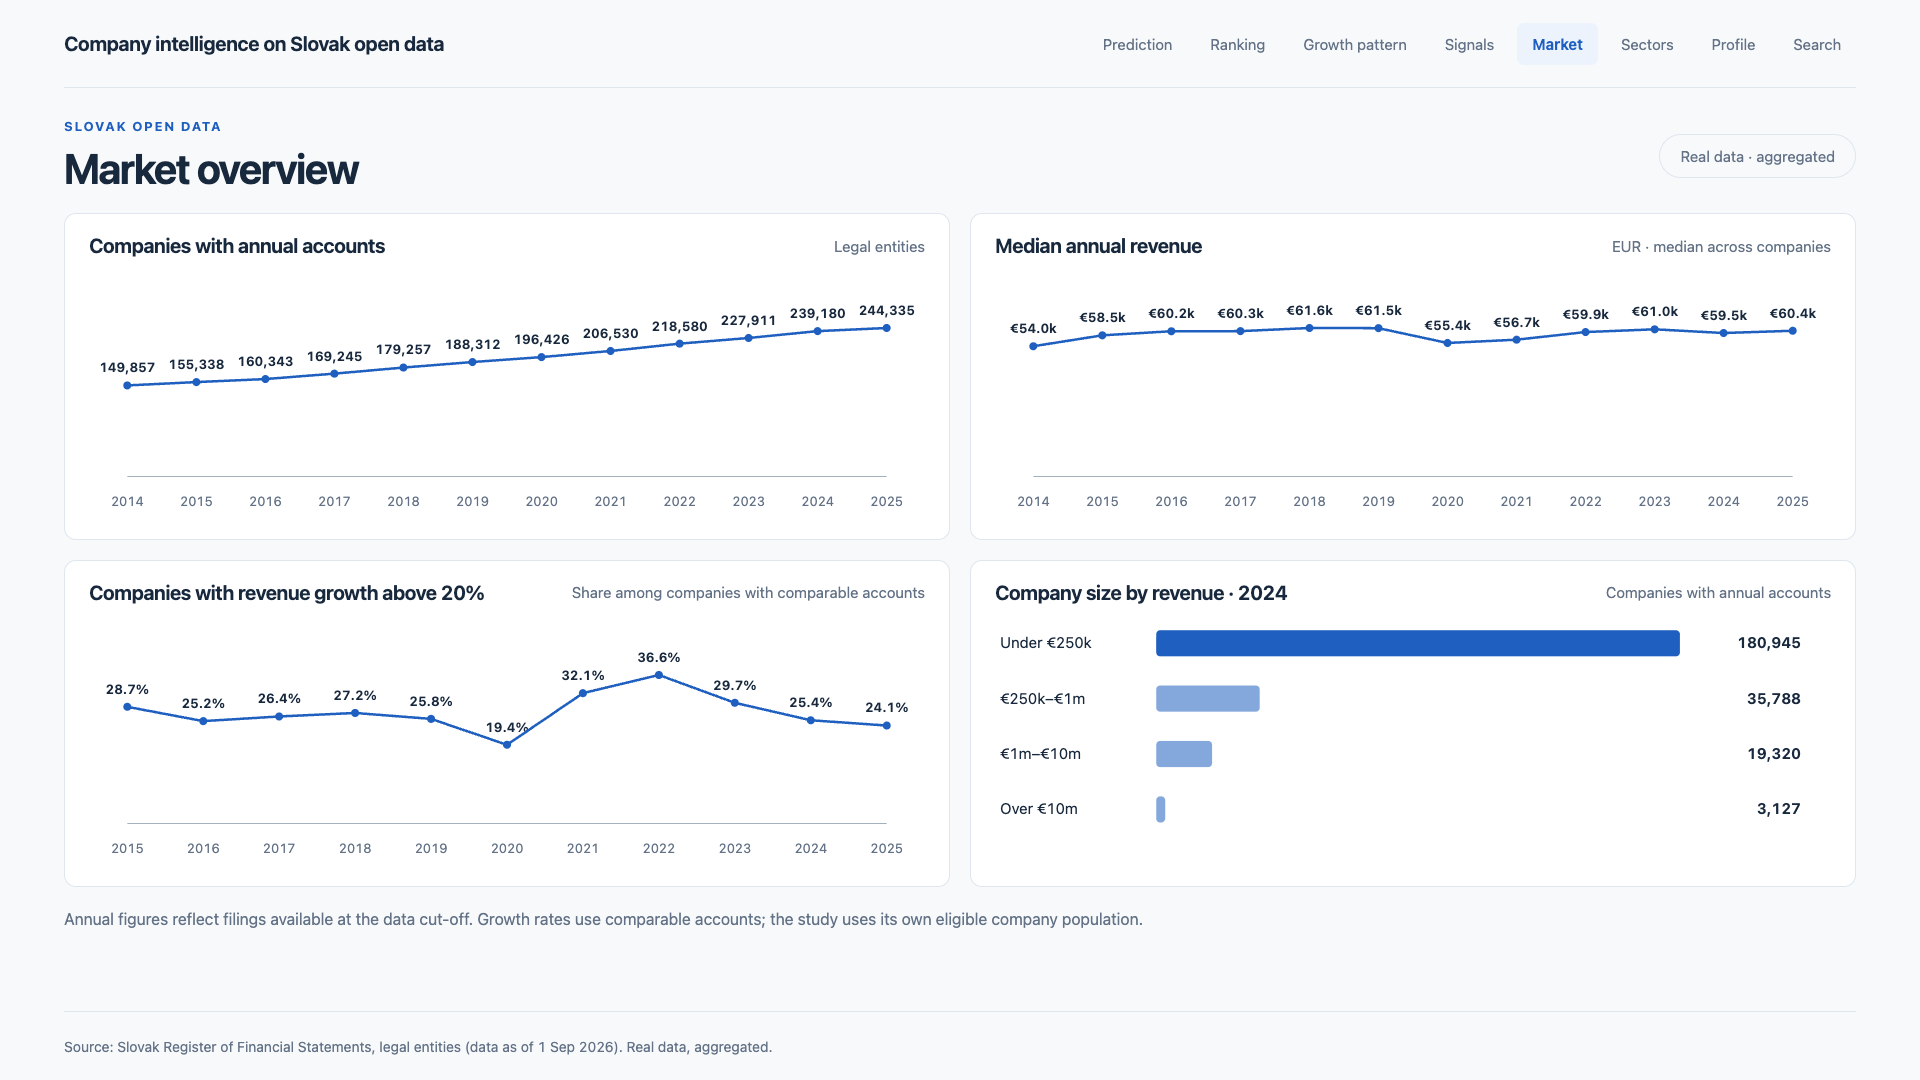
When viewing the market for 2014–2025, the interface shows company counts with filed accounts, median revenue and the share with growth above 20%, alongside revenue size bands for 2024. Growth rates use comparable accounts; the study uses its own eligible company population.
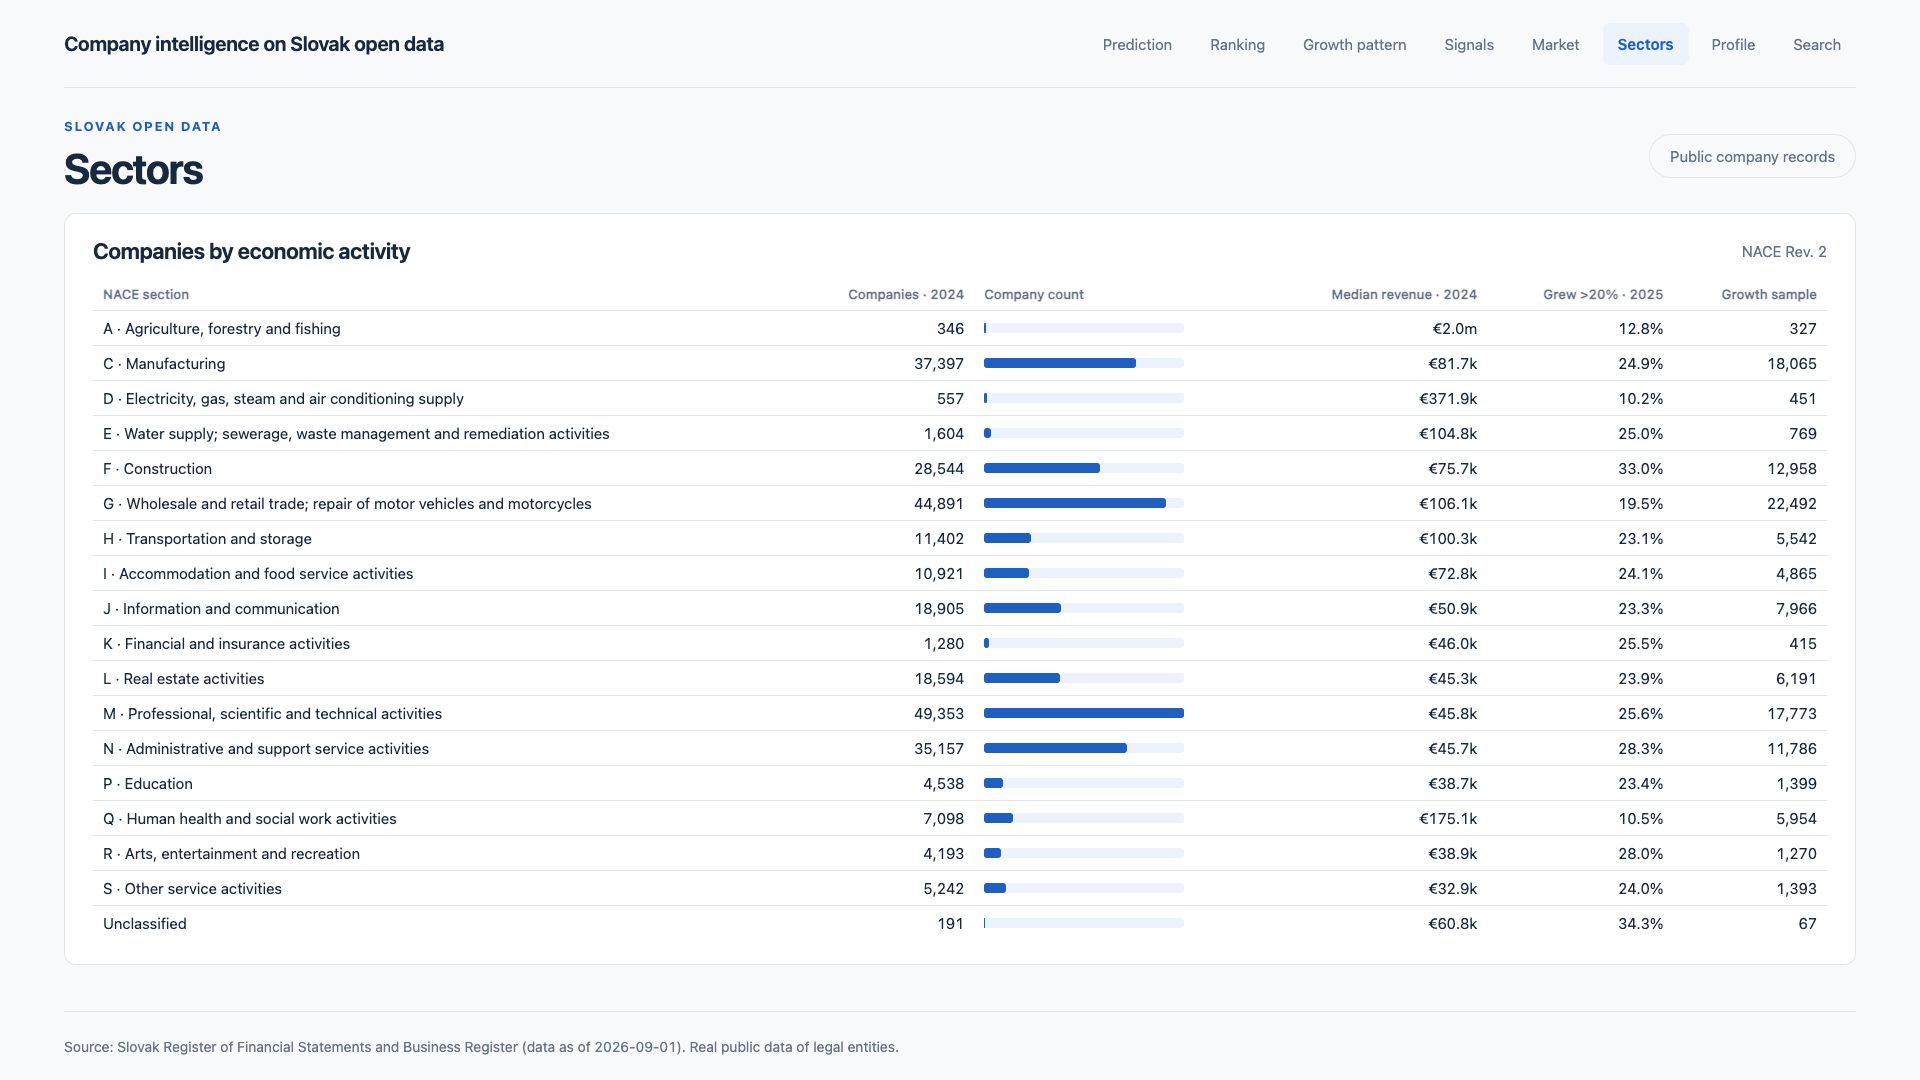
When companies are grouped by NACE section, the interface shows company counts and median revenue for 2024 and the share with growth above 20% in 2025. Groups with fewer than 50 companies are combined.
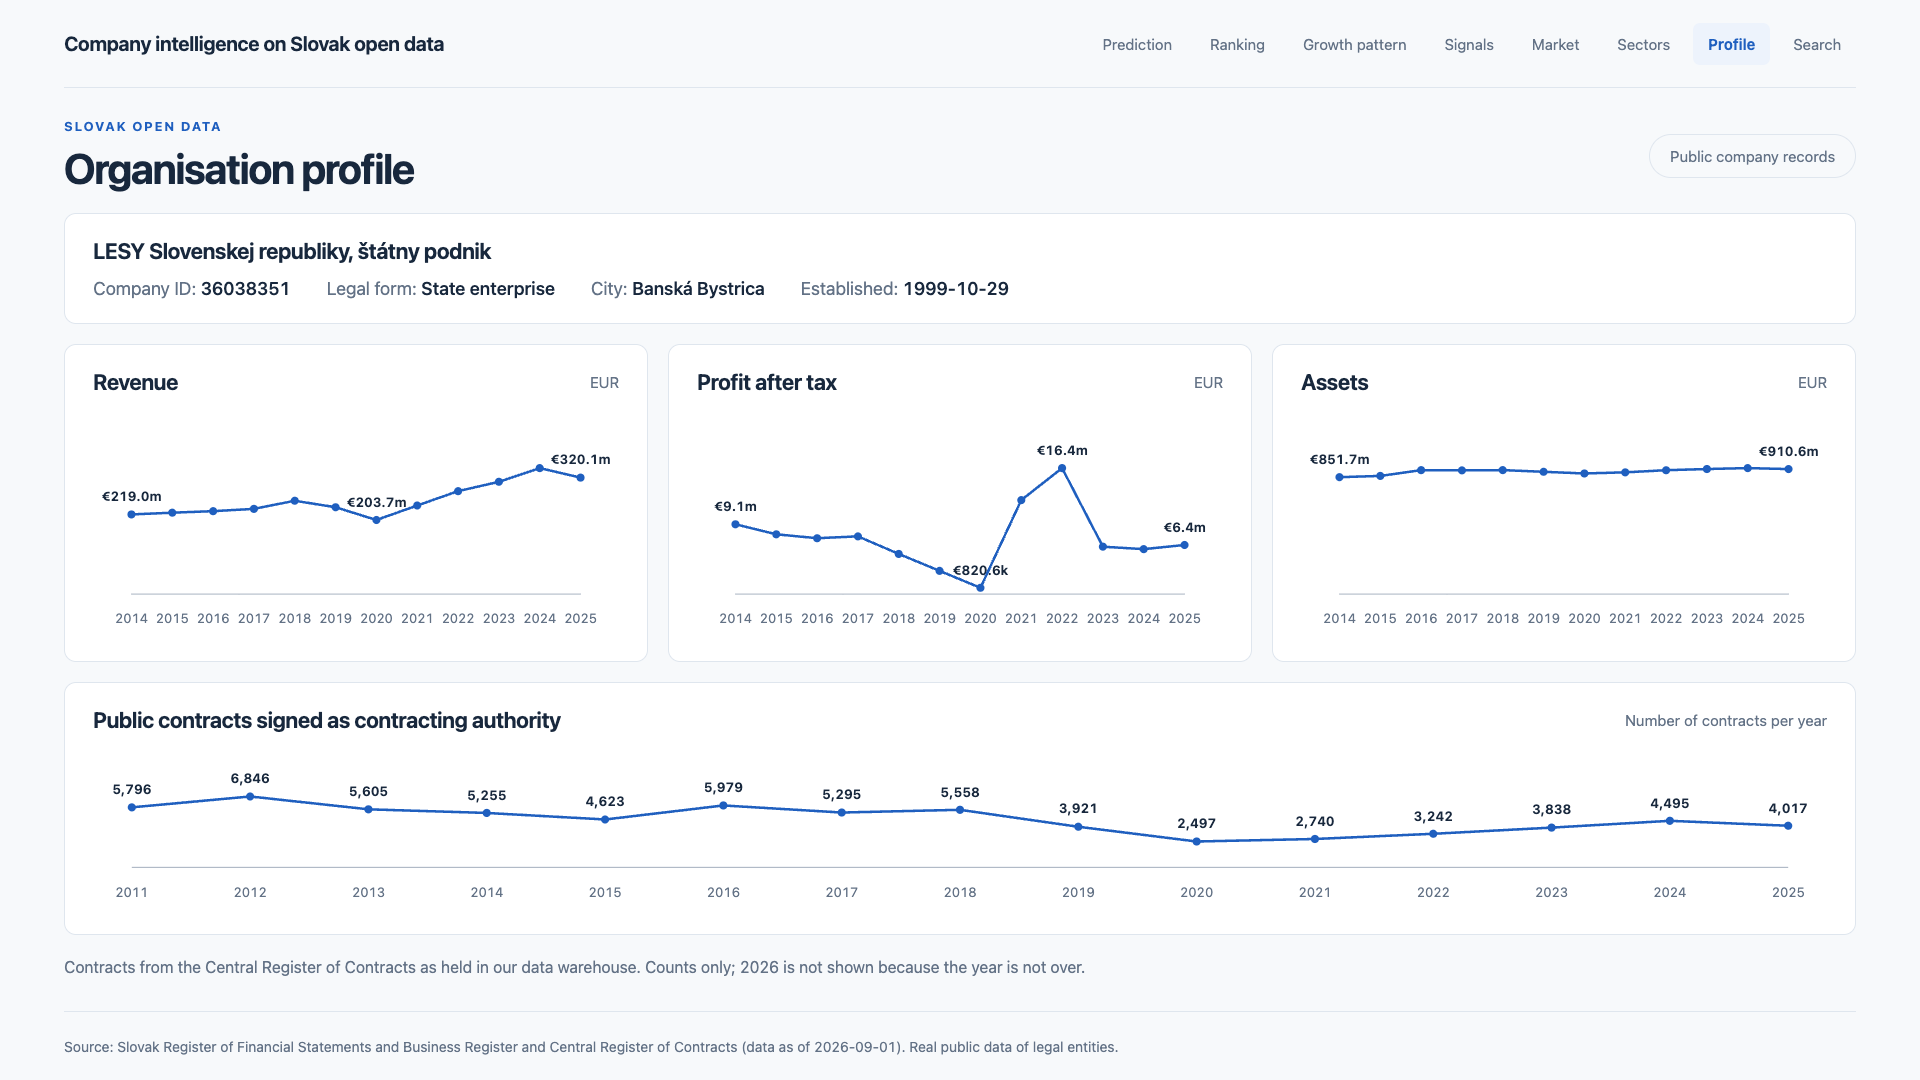
When opening the profile of the state enterprise LESY Slovenskej republiky, the interface shows revenue, profit and assets for 2014–2025 and contract counts for 2011–2025. The contract counts come from the Central Register of Contracts as held in our data warehouse; 2026 is not shown because the year is not over.
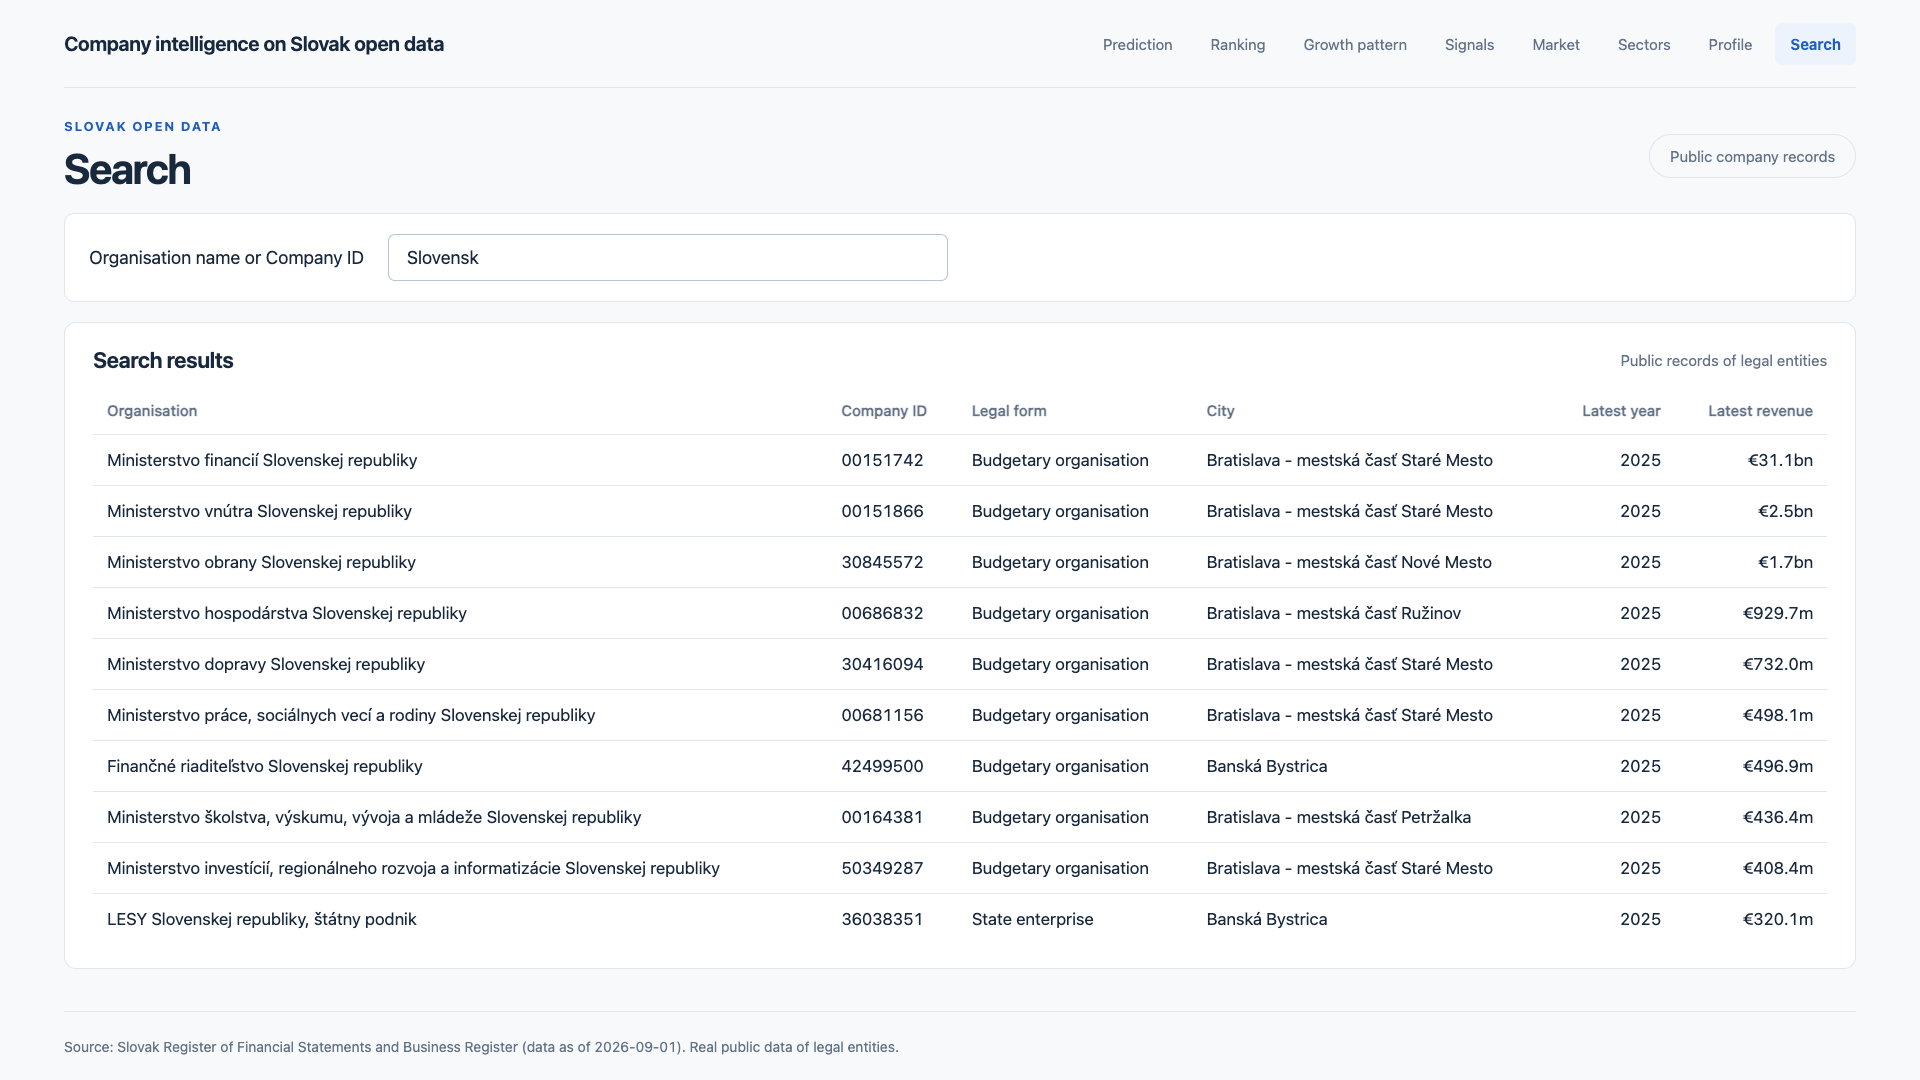
When searching for “Slovensk”, this view shows 9 ministries and authorities (budgetary organisations) and the state enterprise LESY Slovenskej republiky. The displayed results contain only public institutions.
Sources: Slovak Register of Financial Statements, Business Register and Central Register of Contracts; data as of 1 September 2026, real public data of legal entities and aggregated study results.
Start with your own data.
The first conversation is about whether your data carry a reliable signal – not about selling you AI at any cost.
 Open full-size image